Schedule
Route: #/projects/{id}?tab=schedule
The Schedule tab plots the project’s saved views on a timeline. Where the workbench answers “what’s in this view?”, the Schedule answers “when is it happening, and what overlaps?”
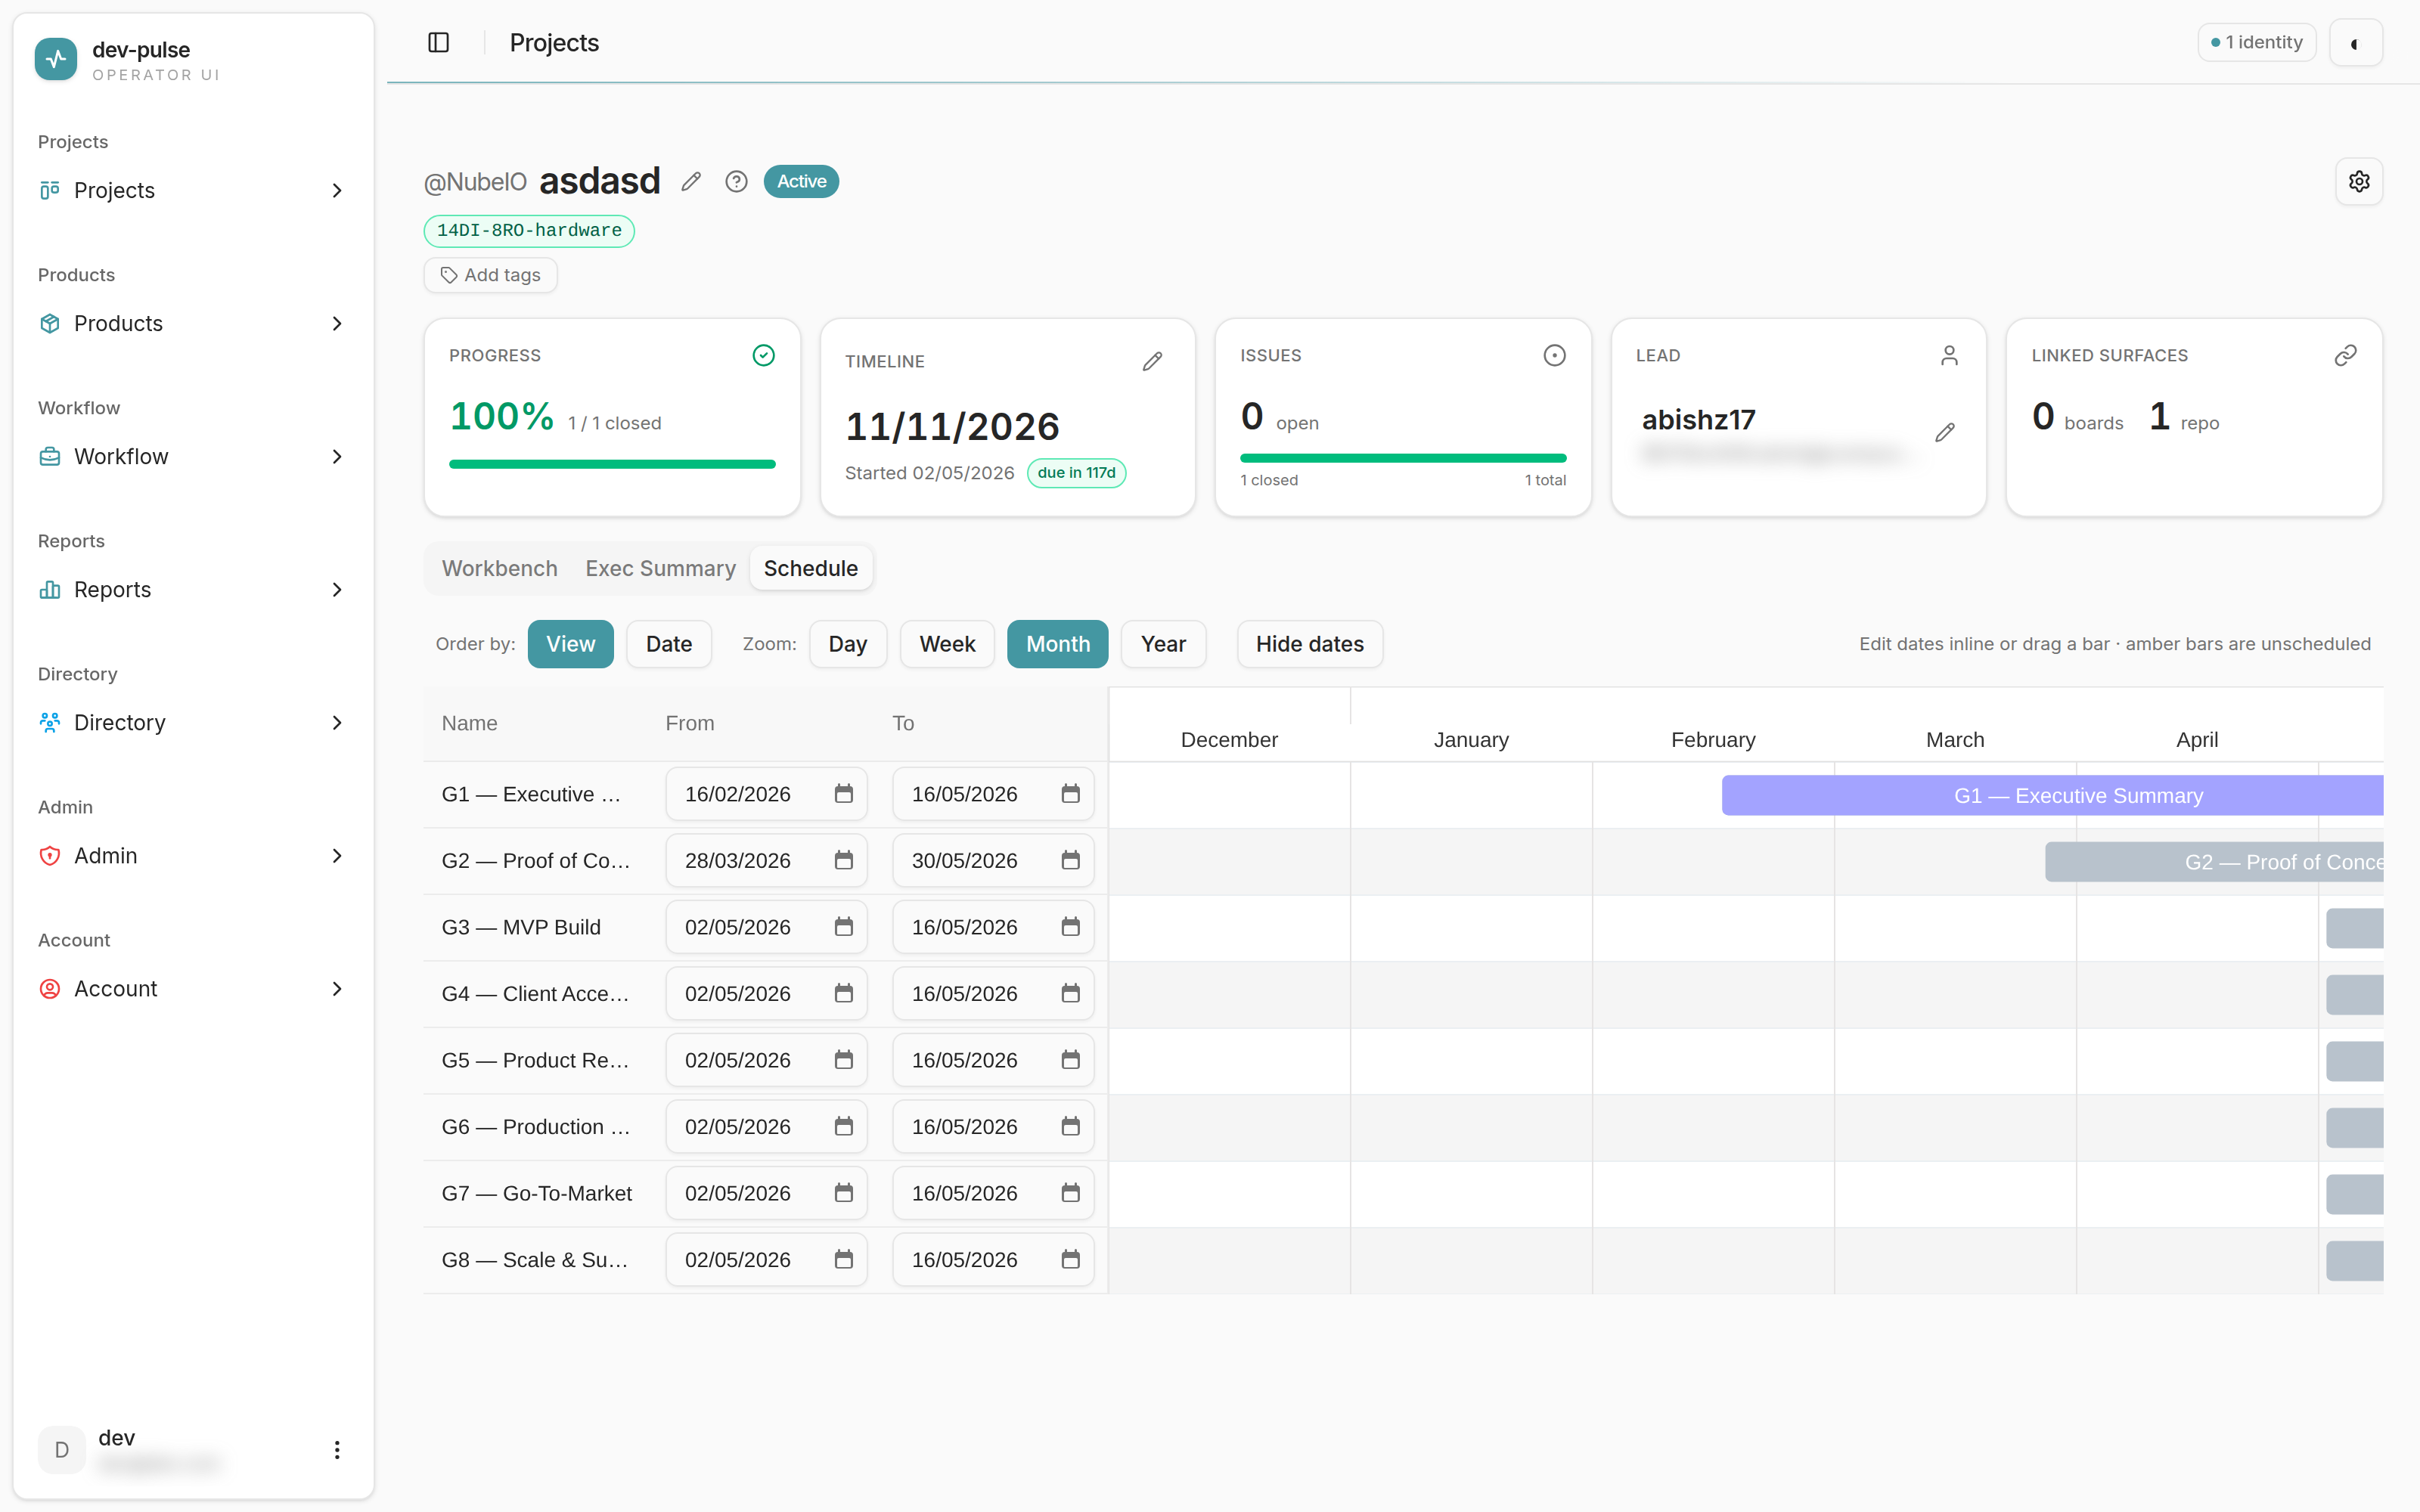
Each row is a saved view — in the screenshot, the G1–G8 gate progression. The left side is an editable table of From / To dates; the right side plots those dates as bars.
The controls
| Control | Options | What it does |
|---|---|---|
| Order by | View / Date | Sort rows by their saved-view order, or chronologically. |
| Zoom | Day / Week / Month / Year | The timeline’s scale. Month is the default. |
| Hide dates | toggle | Collapses the From/To columns, leaving just the Gantt. |
Editing dates
Two ways, and they do the same thing:
- Inline — type into the From or To field on any row, or pick from the date picker.
- Drag — move a bar along the timeline, or drag either edge to change its start or end.
Amber bars are unscheduled — a view with no dates set still gets a row so you can schedule it, but it’s drawn in amber to flag that its dates are placeholders rather than real commitments.
What it’s for
The Schedule is most useful when a project runs a gate progression — G1 Executive Summary, G2 Proof of Concept, G3 MVP Build, and so on. Plotted together, you can see which gates are stacked into the same window and where a slip in one pushes the next.
Views with no dates never block the picture: they sit at the bottom in amber until you give them a range.
Next
- Issue workbench — the views these rows come from.
- Exec Summary